Do Blue or Red States Have Worse Crime?
I've finally figured out why homicide rates by state differ by race.
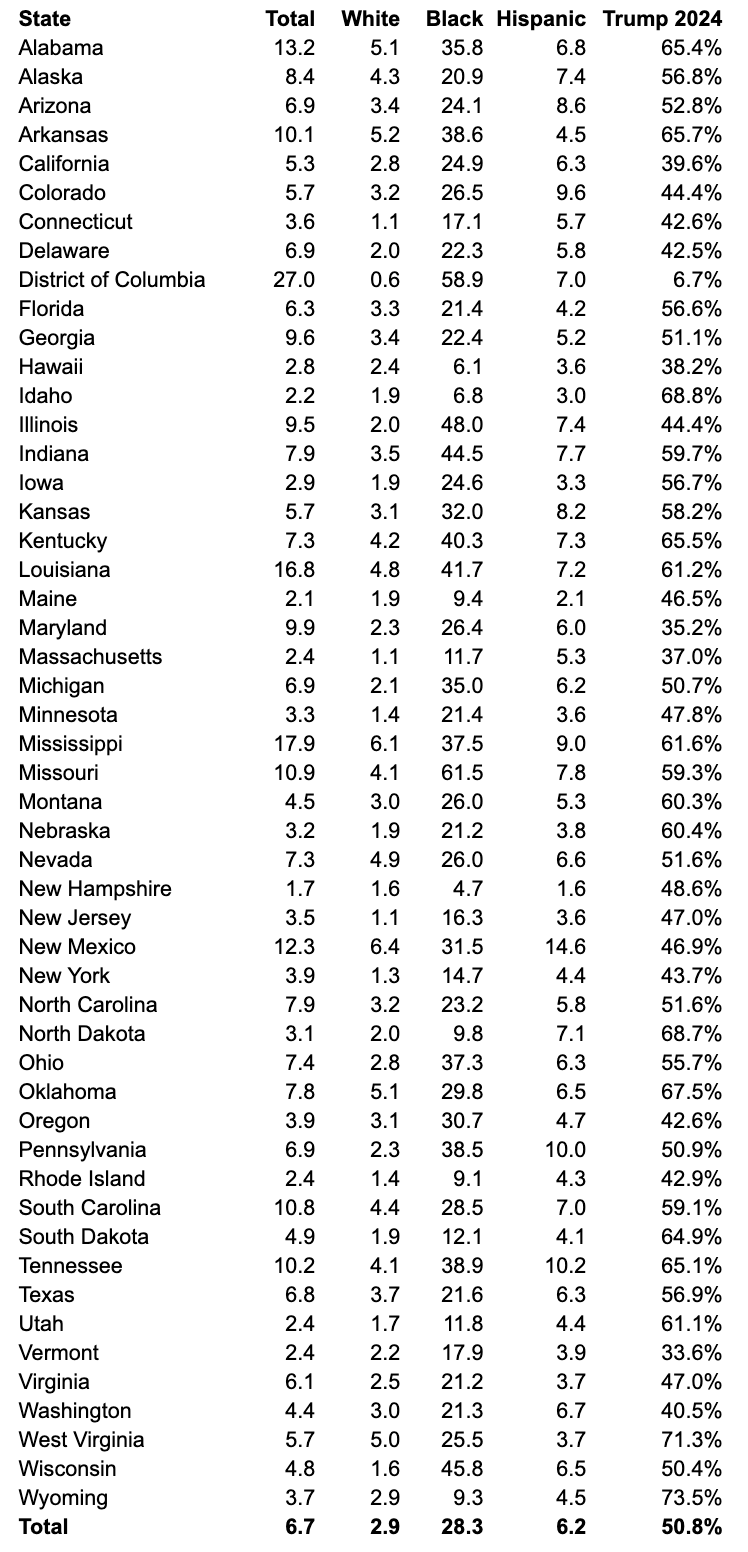
An endless topic of online controversy is whether blue states or red states have worse crime problems. When you look at CDC homicide data for 2018-2024 (of course, killing isn’t the only crime, just that it’s a crime that demands bureaucratic attention), it’s by no means obvious at first glance what the general pattern is:
Of course, I’ve often pointed out that demographic differences seem to matter more than policies: Vermont is always going to have a lower crime rate than Alabama. Nationally, blacks died by homicide 9.9 times as often as whites in 2018-2024, while Hispanics died by homicide 2.2 times as often.
But it’s worth looking at states’ homicide victimization rates by race against the national averages by race. I think I’ve pulled together some data that finally makes a lot of sense out of the debate.
Granted, homicide rates by state differ from homicide rates by city, but it’s easier to obtain homicide rates for the 50 states plus the District of Columbia.
Let’s compare homicide rates by race across states.
For example, in 2018-2024, whites living in D.C. died only 21% as often as did whites nationally, making D.C. less lethal than any state for whites (Massachusetts, New Jersey, and Connecticut were next at 37%-39% of the national white average.)
In contrast, blacks living in Washington D.C. (which the CDC treats as a state) died by homicide at a rate 208% of the national black average per capita rate. Only Missouri, home of the Ferguson Effect, had a worse black average.
Whites and blacks may well socialize less in Washington than in Peoria.
What about Hispanics? D.C.’s Hispanic population was victimized by homicide 113% of the national average, which helps explain why you don’t hear much, good or bad, about Washington D.C. Latinos: they seem to be involved in crime about as often as the national Hispanic average.
As usual, I’m using the CDC’s homicide victimization mortality rates over 2018 through 2024.
In contrast to the CDC’s victimization stats, the FBI collects known murder offender rates. But there are a number of problems with FBI stats, less due to a conspiracy to rig the numbers, one way or another, than that cops really aren’t statheads and seem to worry that people who do like statistics will use them against them.
In contrast, CDC homicide victimization rates aren’t a political football because they are merely a byproduct of the massive national system (involving doctors, coroners, and funeral directors) to collect cause-of-death statistics. Few journalists besides me pay attention to CDC homicide trends, so I doubt that funeral directors are engaged in a massive national conspiracy to rig the numbers.
One problem with focusing on victimization by homicide rather than perpetration of homicide is that innocent victims gets counted.
Still … in general, most murders are intra-racial these days. Black stick-up men shooting white 7-11 clerks is down notably from a generation or two ago.
What happens if you sort the states by white homicide rates? Then, a fairly strong pattern emerges:
Paywall here.


