
NAEP Test Scores: Mississippi Miracle vs. Oregon Outage
Which states do the best job of educating their public school students? Which do the worst?

Which states do the best job of educating their public school students? Which do the worst?
It’s easy to rank states by their raw scores on the federal government’s National Assessment of Educational Progress test, but the learning potential of public school students differs greatly between states. For example, averaging four data points — four and eighth grade 2024 reading and math scores — nationally, Asians average 269, whites 256, Hispanics 233, and blacks 229. Hence, as predicted by Moynihan’s Law of the Canadian Border, more northern states tend to score higher.
So, it’s easier for a state with a lot of Asians and whites to score higher than a state with a lot of blacks and Hispanics. Hence, it’s tricky to figure out which states are doing best at schooling their students, such as they are.
In case you are wondering about NAEP scores, just as the SAT is scored on a 200 to 800 scale with an intended mean/median of 500 and a standard deviation of 100, the NAEP is supposed to be scored on a 0 to 500 scale with a mean of 250 and a standard deviation of 35. But the NAEP is given to 4th graders, 8th graders, and occasionally 12th graders, and the older students score higher.
Practically nobody besides me averages the four 4th and 8th grade reading and math scores to come up with a single number to use in ranking states, but it certainly simplifies things.
Then, I’m going to use the Urban Institute’s methodology for adjusting NAEP scores for demographics (e.g., liberal Vermont has basically no blacks or Hispanics, so it ought to score considerably higher than nearly half-black Mississippi).
First, I’ve taken the raw NAEP scores released in January 2025 (4th grade reading and math and 8th grade reading and math) and calculatd a simple average to rank each state.
Here are the familiar raw score rankings unadjusted for demographics:
Average of 4th and 8th grades reading and math scores, unadjusted:

Not many surprises here: Massachusetts is the brainiest and/or best educated state, a title it has probably held on and off since the 1630s. On the other hand, Massachusetts’ NAEP scores are down to 256 in 2024 from 266 in 2013.
New Jersey and New Hampshire are in second, followed by some northern mountain states: Utah, Idaho, and Colorado.
New Mexico does quite badly in last place. The 25 point difference between Massachusetts and New Mexico is 5/7th of a (stylized) standard deviation, or 0.71 z.
One surprise is that Mississippi, so long the subject of “Thank God for Mississippi” exclamations from rival states struggling to stay out of last place on various measures, has lately reached the middle of the pack with a 245, for 29th place, ahead of much richer New York, Maryland, Texas, and California. Mississippi’s students are 43% white, 47% black, and only 1% Asian.
But these demographically unadjusted scores raises some old nature vs. nurture questions. Does Massachusetts do a good job of educating its kids, so other states should study how Massachusetts does it, or does it just have smart kids?
Not surprisingly, the public school district with the highest test scores in the country, according to Sean Reardon’s Stanford database, is Lexington, MA, where many Harvard and MIT professors choose to raise their families. But Lexington and Concord have also been the intellectual center of America since the Revolution started in Ralph Waldo Emerson’s grandfather’s backyard:
By the rude bridge that arched the flood,
Their flag to April’s breeze unfurled,
Here once the embattled farmers stood
And fired the shot heard round the world.
So, what’s the chicken and what’s the egg in Massachusetts?
And is Mississippi working wonders with what it has got?
And what state has the most self-destructive education policies?
From the Urban Institute:
States’ Demographically Adjusted Performance on the 2024 National Assessment of Educational Progress
Matthew Chingos, Kristin Blagg
January 29, 2025
Earlier today, the federal government released the 2024 scores from the National Assessment of Educational Progress (NAEP). NAEP is the only nationally comparable measure of student achievement that is reported for every state on a regular basis, but comparing states’ NAEP scores is misleading for many purposes because states serve very different student populations. For example, more than 20 percent of children live in poverty in Alabama and Mississippi, compared with less than 10 percent in New Hampshire and Vermont.
For nearly 10 years, the Urban Institute has published adjusted scores that capture how well students in each state score on the NAEP compared with demographically similar students around the country. We determine these adjustments by calculating how each individual student who takes the NAEP scores relative to students nationwide who are the same gender, age, and race or ethnicity and have the same free and reduced-price lunch receipt status, special education status, and English language learner status.
So, they largely adjust for race/ethnicity, but also throw in adjustments for some other demographic characteristics that the NAEP collects: income (as measured by free lunch eligibility), special ed, and immigrant kids who are learning English at school.
Seems reasonable.
We calculate adjusted scores for 2024 using our analysis of student-level data from 2022 and applying it to the unadjusted 2024 scores released earlier today.
In other words, to get their 2024 adjusted numbers out fast on the first day the unadjusted numbers were available, they just re-used the demographic adjustments they had previously laboriously calculated in 2022.
Sounds okay.
Our prior research has shown that this is a reliable way to adjust the state-level scores before student-level data are available.
These adjustments have important limitations, including challenges with accurately measuring income across different states and differences across states in the implementation of programs like special education.
For example, it could be that in some states, there’s a cultural tendency for, say, rich, smart parents to get their kids some kind of special education status so they get more time on tests or whatever.
But the adjusted scores come closer than the unadjusted scores to capturing the relative effectiveness of state policies.
That they do.
So, here’s my graph of their adjusted scores, averaging the four 2024 data points (4th and 8th grades, reading and math):
Average of 4th and 8th grades reading and math scores, unadjusted in blue, adjusted for demographics in red:

The Mississippi Miracle is number 1 after adjusting for its unpromising demographics, with comparable Louisiana in second.
The Mississippi Department of Education’s press release boasts of Mississippi’s striking improvement since the legislature passed a number of laws in 2013 (modeled on Florida’s 2002 reforms) to get serious about teaching reading and math.

Louisiana followed Mississippi’s lead, with comparable payoffs. Alabama has more recently followed its neighbors, which seems to have lifted Alabama’s test scores from awful to not-so-hot. Time will tell if Alabama follows its neighbors Mississippi, Louisiana, and Florida into the adjusted top ten.
I’ll discuss some of the other states first, then return to an in-depth exploration of the Mississippi Miracle and the Oregon Outage after the paywall.
Massachusetts comes in third in unadjusted scores, so it appears to be doing a good job on nurture as well as exploiting its nature.
I vaguely recall that around 1990 there was a broad movement in Massachusetts to upgrade the quality of government from the traditionally corrupt and lackadaisical kind seen in movies like The Departed to something more suitable for the state’s impressive level of talent. For example, Bill Bratton became top cop in Boston in 1993.
Texas comes in fourth when its mediocre demographics are accounted for. Texas used to put a thumb on the scale of its NAEP scores by encouraging more of its dimmest students to stay home on NAEP test days than most other states, but recent reforms have led to most states having participation rates within a narrow band. For example, on the 2022 NAEP, Texas was a little above average in getting both 4th and 8th graders to show up and take the test.
I’m still not sure I believe Texas’s NAEP scores, but Texans are not dumb. The state has mostly poor soil, so it never had a lot of farmers. And it had oil and gas rather than coal, which seemed to attract a better sort of worker than, say, West Virginia. (Old time pick and shovel underground coal mining was a hard, terrifying job, so people with other opportunities avoided it.) Ergo, Texas has, over the last 160 years, tended to attract people looking to get ahead in the modern American economy rather than in farming or underground mining.
Worst on the demographically adjusted list is Oregon, which has perhaps the highest percentage of truly Woke crazies in the country. Unadjusted, Oregon outscored the country on 8th grade math by 8 points in 2000, but trailed by 4 points in 2024.
Oregon 8th grade math, unadjusted:

How is Mississippi doing it? How is demographically blessed Oregon botching up so badly? Is there a correlation between how states vote and how well their schools work?
These questions are answered, to the best of my ability, in the 1,600+ words after the paywall.
First, miraculous Mississippi does not seem to be playing games by excluding more students from taking the NAEP than most other states. Its response rate for both 4th and 8th graders was above the national average in 2022.
Mississippi’s rise seems to be related to education reform laws passed in 2013, following the Republicans taking control of the governorship, the state senate, and the state lower legislature in 2012 and not giving up any of them since.
One big step Mississippi’s GOP leadership took was making Mississippi third graders pass a reading test before promoting them to 4th grade (when some of them would take the NAEP), which they started doing in 2015.
The saying is that you learn to read in grades 1 through 3 and read to learn from grade 4 onward, so holding back third-graders who haven’t fully learned to read for a fourth year of learning to read instruction makes more sense than shoving them immediately into grade 4 where they will be increasingly lost. So, Mississippi holds back perhaps 7% to 10% of its third graders, or an average of three students if there are 35 in a classroom: that’s enough to draw attention pour encourager les autres, so that probably gets other students to work harder so they won’t be held back.
You can see the spectacular effect on unadjusted 4th grade reading test scores in this graph, with Mississippi’s 4th grade reading scores going from 12 points below the national average to 5 points above. (All the following types of graphs that I didn’t make myself use unadjusted raw data:)
Mississippi 4th grade reading unadjusted:
The 2024 reading test scores for Mississippi’s curated black 4th graders are impressive: 8 points above national black average.
Not surprisingly, Mississippi’s huge advantage from holding back third graders selected precisely because they are likely to score badly on the NAEP 4th grade reading test tends to partially fade out by the 8th grade reading test:
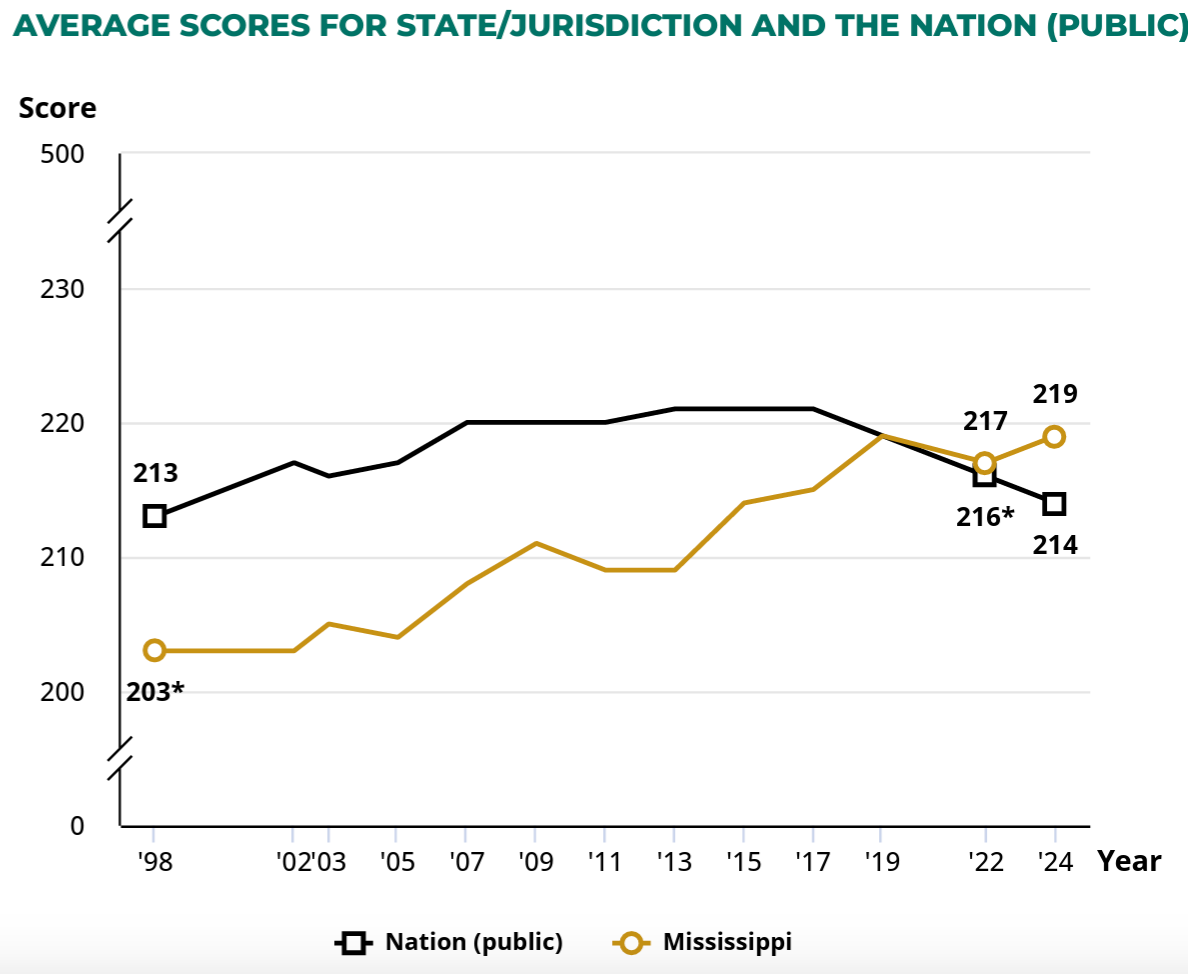
Mississippi 8th grade reading unadjusted:

Still, Mississippi 8th graders being only 4 unadjusted points behind the national average for all races is not bad.
By 8th grade, Mississippi’s black students’ reading score has fallen to the national black average, but that’s still better than you’d expect for what’s perhaps the poorest and most rural black population in the country.
The effect of holding back weak-at-reading third graders for a second go-round in third grade also had spectacular effects on Mississippi’s 4th grade math scores:
Mississippi 4th grade math unadjusted:

In 2024, Mississippi’s black 4th graders score 8 points above the national black average on math.
Mississippi is fading but still doing pretty well in 8th grade math:
Mississippi 8th grade math unadjusted:

Back in 2000, Mississippi 8th graders trailed the nation’s public school average in math by a full 18 points, but by 2015 had narrowed that to ten points. Since 2015, when the rest of the country collapsed during covid and the racial reckoning, Mississippi held its ground better, adding 3 points from 2022 to 2024, and now is only 3 points below the national average.
In 2024, Mississippi’s white 8th graders scored 284 in math, the national average for whites (which is pretty good because Mississippi generally lacks large high-scoring white groups like Jews, Episcopalians, and big city suburbanites (its leading suburbs are in the sports-crazed Memphis metro area, as seen in the movie The Blind Side, which isn’t like being in the suburbs of San Francisco, DC, Boston, New York, or even Chicago).
Mississippi’s blacks score 4 points above the national black average at 255, which is quite good because Mississippi lack metros attractive to upscale blacks like Atlanta and DC do. The cotton-growing Mississippi Delta in northwestern Mississippi is the most famous concentration of black rural poverty in the country.
But Mississippi has more than One Weird Trick up its sleeve. It also aligns its reading instruction closely with what is tested on the NAEP, which ought to give a one-time boost in scores. But that’s pretty defensible: unlike many other states that optimize their curricula to boost scores on their own idiosyncratic state test, Mississippi is agreeing to follow neutral federal standards.
Even more legit is that Mississippi has focused since 2013 on a phonics-centric system for teaching reading.
There are two main approaches to teaching reading: phonics and whole-word. Phonics seems to work better on average and below-average kids, but it was long out of fashion because the more verbally facile people in the education schools tend to be whole-word readers. Granted, Ed School profs are the dumbest professors on average, but, still, college professors tend to be pretty smart.
So, if whole-word works for a Stanford Ed School professor and her kids, then why wouldn’t it work for a Clarksdale, MS third grader?
For example, I must confess that I am almost completely a whole-word reader, almost never stopping to sound out a word. I just glance at the first few letters in a word and guess. The vast majority of the time, whole-word reading works fine for me.
Not surprisingly, I’ve been a facile reader since I was five. Whole word reading works great for me! But I don’t recommend it to grade schools in the Mississippi Delta.
But it’s also why I sometimes confuse words and phrase that start the same way. For example, I might skim a headline that reads “Whooping Crane Makes Comeback from Verge of Extinction,” and say to myself, uh-oh, I had whooping cough once and it was no fun; it’s too bad they weren’t able to wipe out whooping cough the way they did smallpox.
In general, it appears that Mississippi is making progress by being realistic about its human capital. Instead of succumbing to progressive education fads that begin by assuming that your students are self-motivated prodigies, the Mississippi Miracle is based on the assumption that its students aren’t necessarily the sharpest knives in the drawer, so they need basic education tailored to their abilities, not fantasies about self-actualization.
Also, it appears that Mississippi’s reforms tend to make teaching less creative. Teaching tends to appeal to theater kids who like doing creative stuff in front of an audience, so most schools tend to allow teachers to try out the latest fad and their various brainstorms, most of which don’t work particularly well, but at least keep the teachers hopeful and motivated.
Since 2013, however, Mississippi has been drilling teachers on “the Science of Reading,” which doesn’t sound like that much fun for teachers other than the satisfaction that these time-tested drills tend to work a little better than the latest creative breakthrough sweeping the more progressive states.
In contrast, there’s Oregon, which now ranks dead last in demographically adjusted test scores.
Oregon has a lower percentage of students showing up to take the NAEP than the average state, so that’s no excuse.
In Oregon, all students are eligible for free school lunches (because American kids aren’t fat enough), which may mess with the demographic adjustments.
Oregon’s white students in 8th grade math average 277, 7 points below the national average.
Yet, Oregon was a moderately fashionable destination for whites since the rise of Nike around 1990
until perhaps the nonstop Antifa rioting during the Summer of George.
But Portland hipster whites have had very low fertility rates.
With only 3% black students, the NAEP doesn’t have enough to report a reliable score for blacks in Oregon. But Oregon’s 1/4th of students who are Hispanic score very badly, 245, 12 points below the national Hispanic average and last among states, coming in ahead of only dilapidated Puerto Rico.
In 8th grade reading, Hispanics in Oregon score 4th worst of the 50 states.
During the Racial Reckoning, Portland lowered its educational standards to be softer on Children of Color. The Oregonian reported in 2023
Updated: Oct. 19, 2023, 10:23 p.m.|
By Sami Edge | The Oregonian/OregonLive
Oregon high school students won’t have to prove basic mastery of reading, writing or math to graduate from high school until at least 2029, the state Board of Education decided unanimously on Thursday, extending the pause on the controversial graduation requirement that began in 2020. …
Opponents argued that pausing the requirement devalues an Oregon diploma. Giving students with low academic skills extra instruction in writing and math, which most high schools did in response to the graduation rules, helped them, they have argued.
But leaders at the Oregon Department of Education and members of the state school board said requiring all students to pass one of several standardized tests or create an in-depth assignment their teacher judged as meeting state standards was a harmful hurdle for historically marginalized students, a misuse of state tests and did not translate to meaningful improvements in students’ post high school success.
Higher rates of students of color, students learning English as a second language and students with disabilities ended up having to take intensive senior-year writing and math classes to prove they deserved a diploma. That denied those students the opportunity to take an elective, despite the lack of evidence the extra academic work helped them in the workplace or at college, they said.
While Republican Mississippi and Woke Oregon are examples of rightist politics helping and leftist politics hurting public school effectiveness, nationally there’s no correlation between Trump’s share of the 2024 vote and either the Unadjusted NAEP Average (correlation coefficient of -0.06 or ever so slightly favoring blue states) or Adjusted NAEP Average (correlation coefficient of 0.03, or ever so slightly favoring red states).
For example, while Gulf Coast Republican states do pretty well in demographically adjusted test score,s other Republican states do poorly. Among the ten worst states adjusted for demos, the Hall of Shame includes red (as of 2024) Michigan, red Missouri, red Arizona, blue Hawaii, blue Vermont, blue Maine, blue Delaware, red West Virginia, red Alaska, and blue Oregon.
Still, this finding of no correlation might be misleading. The issue is complex because Republicans tend to dominate in two types of states: ones like Wyoming where everybody is white, and ones like Mississippi where whites must maintain a high degree of political solidarity or their state will get turned into Detroit.
If you look at test scores for whites:

blue states do somewhat better (correlation coefficient of NAEP 8th grade math scores vs. Trump’s share of the two-party vote: r = -0.29).

This might possibly suggest that Republicans make better laws for nonwhites and Democrats make better laws for whites.
That is kind of mindblowing if you only read the New York Times, but if you read me, it all makes a certain amount of crazy sense.
Oregon being dead last is not surprising. That state is basically far left lunatic Portland combined with far right redneck countryside. Downtown Portland was the grossest city I’ve ever seen (and I commute to SF). Eastern Oregon was full of people, who when I told them of a rare wildlife sighting (eagle, rattlesnake), responded with “did you shoot it?”
Steve, I think you and several commenters have a slight misconception about the difference between 'word' readers and 'phonics' readers. That is, once you're a fluent reader, there really are only 'word' readers. Phonics is critical in the initial stages of learning to read, but then it becomes less important as vocabulary and word recognition rapidly increase. It's a bit like training wheels.
The problem with teaching kids to recognize words is in how this has been carried out in schools. In short, many children in English speaking countries have been the victims of gross educational malpractice packaged as 'reading recovery', 'whole language', 'balanced literacy', and other programs premised on the assumption that learning to read should be 'natural', and that if kids are just exposed to lots of reading out loud, and then are given stories they like, their reading ability will blossom and grow like a beautiful wildflower, without them having to be subjected to nasty repetitive rules-based algorithms such as phonics. They're explicitly taught to guess what words are based on photos, or by just blurting out whatever they think might make sense coming next. They're *discouraged* from taking advantage of one of humanity's greatest inventions, i.e. alphabetic written characters, so that their teachers can cop good feelz because they're not 'drilling and killing'.
This has been going on for the better part of a century, although it really got bad in the early 2000s. I strongly recommend a recent podcast series called 'Sold a Story', in which a journalist (give her a chance; she's remarkably even-handed) named Emily Hanford traces out this sad tale in vivid detail. This podcast has been extremely influential, and has essentially turned the field of literacy teaching upside down in the USA, to the point that many states have based their schools' approach to reading based on its findings.
There's a good summary of the podcast and its effects from Forbes here: https://www.forbes.com/sites/nataliewexler/2022/10/20/new-podcast-examines-why-teachers-have-been-sold-a-story-on-reading-instruction/
Info on the podcast itself is here: https://features.apmreports.org/sold-a-story/
It's a well-produced and extremely listenable story.
Incidentally, I also used Siegfried Engelmann's phonics-intensive *Teach Your Child to Read in 100 Lessons* to teach my daughter to read. She was a precocious child, so we started when she was 3 and half. She cruised right through it, and was reading pretty fluently at 4. It's an excellent resource that I would highly recommend.