
Who Should Be MVP?
Ohtani or Crow-Armstrong?

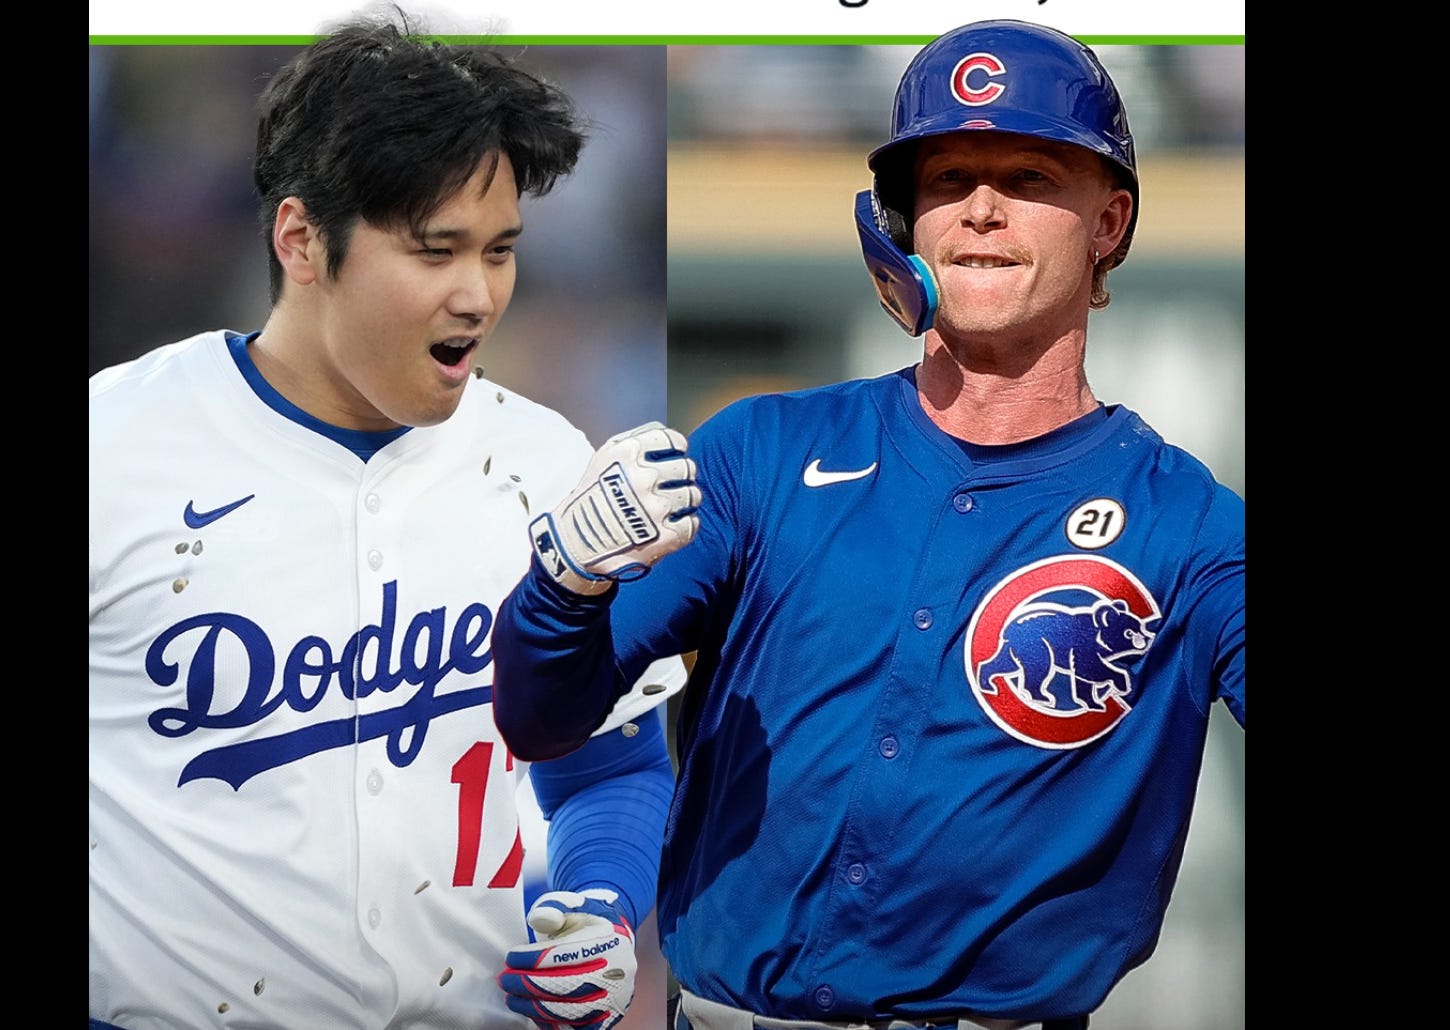
Back in May, I wrote about Pete Crow-Armstrong, the young centerfielder of the Chicago Cubs from my neighborhood, who was off to a great start. He’s the son of a couple of television actors, which is a rare ancestry for star jocks.
In the race for Most Valuable Player, Crow-Armstrong remains probably the top defensive player in the National League, but the great Shohei Ohtani, winner of three MVP awards in the last four years, has been grinding him down as a slugger.
And Ohtani has recently returned to pitching, the first double-duty star since Babe Ruth in 1918-1919.
And the Milwaukee Brewers, despite a lack of stars, have pulled away from the Cubs in the National League Central division.
Crow-Armstrong’s On-Base Percentage has dropped to a lousy .300.
Still …
I looked at a statistic that I’ve never seen anybody talk about before: hitting in wins vs. hitting in losses.
One of the splits that Baseball Reference offers for hitters is OPS (On-base Plus Slugging) in wins vs. losses. Say that a batter comes to the plate five times in a win and gets one double, one walk, and makes three outs. Then his On-Base Percentage for that game is 2/5 or .400, and his Slugging Average for that game is 2/4 or .500. Add them together for a fine OPS of .900.
Unsurprisingly, star players usually hit a lot better when their teams win than when they lose (no doubt partly because the star's strong game propels the team to victory more often, but also because wins are usually against weaker pitchers).
Looking at the National League Most Valuable Player race in 2025, I see that Shohei Ohtani's OPS in Dodger victories is a tremendous 1.157, while his OPS in losses is a pretty good .822, a ratio of 1.41.
That seems like a pretty standard ratio for a star hitter. For example, Babe Ruth’s career OPS ratio in wins vs. losses was 1.36. Barry Bonds’ career ratio was 1.41. Mickey Mantle 1.44. Ted Williams 1.34. Lou Gehrig 1.37. Aaron Judge 1.53. Mike Trout 1.34.
What about individual seasons?
For example, Ichiro Suzuki came over from Japan in 2001 and won the MVP and Rookie of the Year awards as the Seattle Mariners went a record 116-46. His ratio was 1.77.
Similarly, teammate Aaron Boone had a 1.58 ratio while driving in an improbable 141 runs.
In contrast, Crow-Armstrong's OPS in Cubs wins this season is 1.023 but in losses is .503, an extraordinary ratio of 2.03.
It appears that Crow-Armstrong is the straw that stirs the Cubs’ drink this season. He has a poor On-Base Percentage, so he hits lower in the Cubs’ order. But when the Cubs get a man or two or three on base ahead of him and he comes through with an extra-base hit, it’s apparently a big deal in whether they win or lose.
My long-time view is that MVP award is retrospective rather than prospective, in contrast to most uses of baseball statistics. It makes sense to award guys who won ballgames rather than guys who should have won ballgames. On the other hand, when deciding how much to pay players, it makes more sense to emphasize players who ought to be good in the future rather than in the past.
I'm wondering whether any baseball stats pundit has commented on this Wins vs. Losses OPS ratio before and, if so, what are historically high ratios for star MVP contenders?
Schwarber.
> For example, Ichiro Suzuki came over from Japan in 2001 and won the MVP and Rookie of the Year awards as the Seattle Mariners went a record 116-46. His ratio was 1.77. Similarly, teammate Aaron Boone had a 1.58 ratio while driving in an improbable 141 runs.
That would be Aaron's older brother Bret