
Why Are Kids Getting Dumber?
Public school test scores dropped dismally during the Great Awokening and Covid.

From the New York Times news section:
Why U.S. Test Scores Are in a ‘Generation-Long Decline’
The drops go beyond the pandemic and cut across income, geographic and racial divides, new data shows.
By Claire Cain Miller, Francesca Paris, and Sarah Mervosh
May 13, 2026
Something troubling is happening in U.S. education.
Almost everywhere in America, students are performing worse than their peers were 10 years ago, according to new, district-level test score data released Wednesday by the Educational Opportunity Project at Stanford.
This new database is a continuation of Sean Reardon’s Stanford Educational Data Archive of school test scores from all 2000+ public school districts in the country in 2009-2013 normalized against state-level NAEP scores, which I wrote two major in-depth Taki’s Magazine articles about in 2016 and 2019:
Back then, Reardon only had data from 2009-2013, so he couldn’t yet look at long term trends, although as I pointed out in my columns, there were plenty of fascinating things that could be learned just from comparing school districts at one point in time.
Now he can measure trends.
And they mostly aren’t good.
Compared with a decade earlier, reading scores were down last year in 83 percent of school districts where data was available. Math scores were down in 70 percent. The declines have affected both rich and poor districts, and crossed racial and geographic divides.
Demographic change definitely didn’t help.
But, on Twitter, Crow Magnon posted this graph showing all races doing worse. Asians declined the least, whites second least, Hispanics third, and blacks dropped the most:
UPDATE: Commenter Perry Arcone points out that if rank-ordered by absolute loss in points then whites fell more than Hispanics. But Hispanics started with fewer points than whites, so the graph shows their decline as slightly steeper in percentage terms.
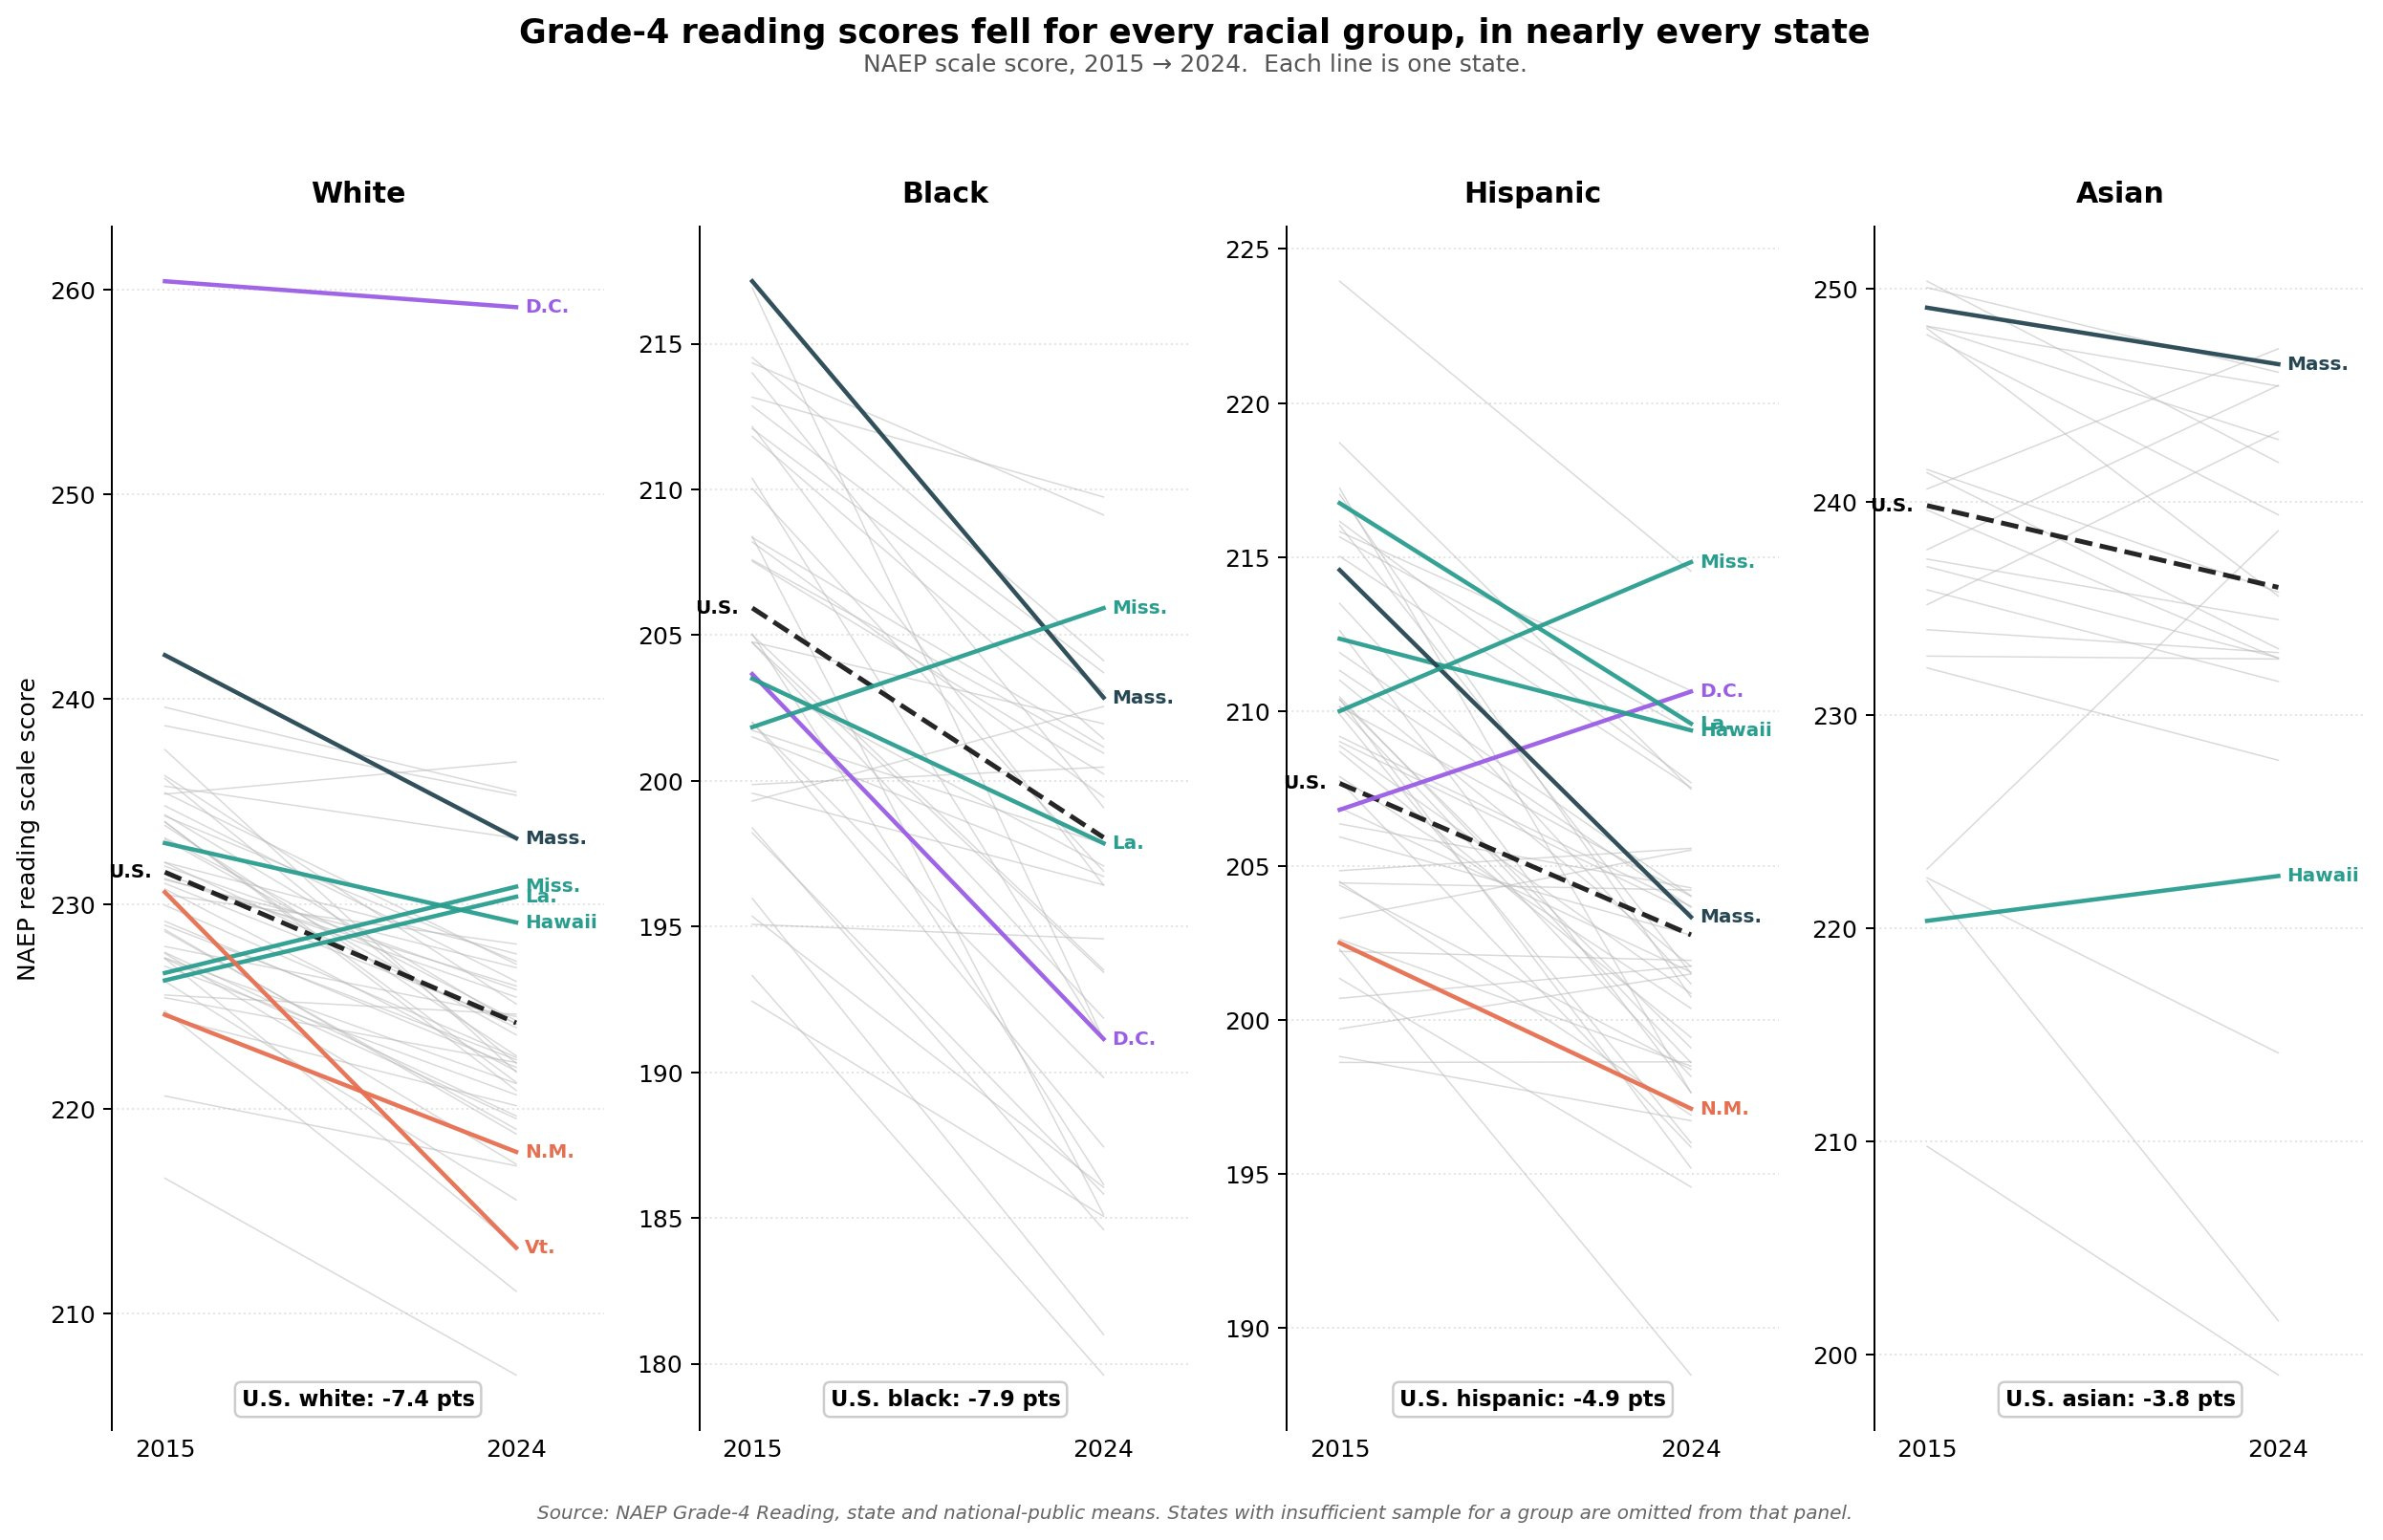
Not surprisingly, black performance from 2015-2024 fell the most of the four major races during the Great Awokening/Racial Reckoning era, when American elites became convinced that American society is, in effect, too tough on blacks. I mean, what else could possibly be the cause of black problems other than whites being mean to blacks via systemic racism? As the SPLC teaches us, it would be overt racism to suggest that there are any other reasons why blacks might average low on test scores and high on homicide deaths.
So the solution, in effect, was to let African Americans slack off in school without being flunked, to stop them less on the streets and thus let more blacks carry illegal handguns to parties, and to let blacks speed more without being pulled over.
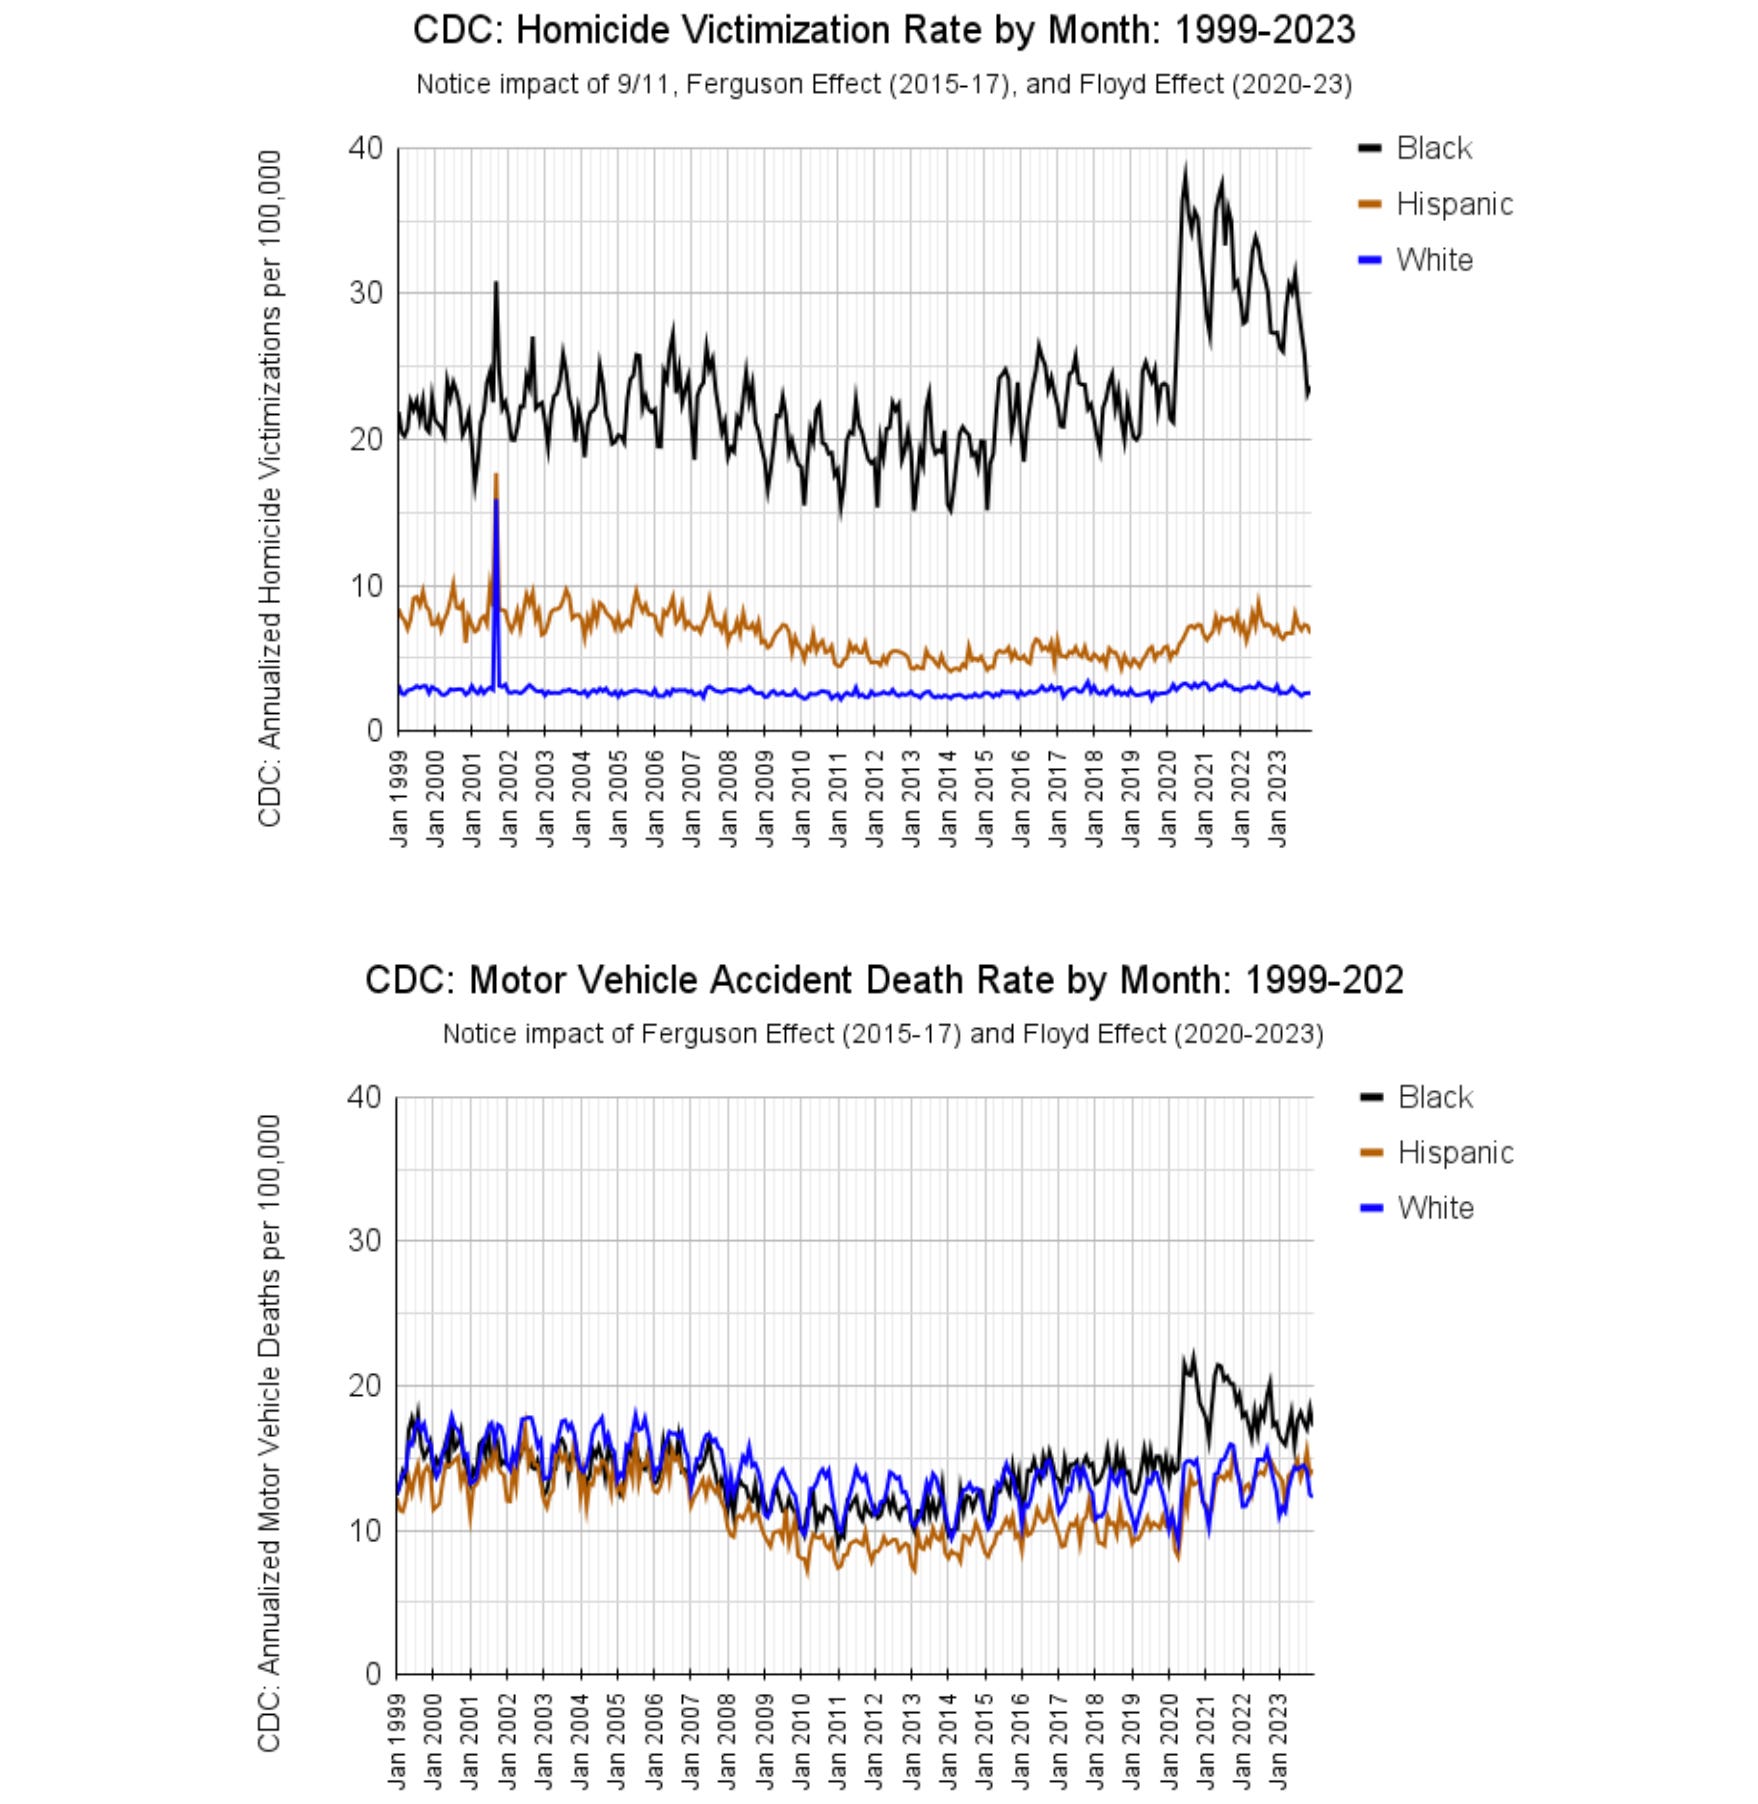
So, after Ferguson in 2014, black test scores went down the most, while black homicides deaths rose and so did black motor vehicle deaths, especially after George Floyd in 2020.
The new data provides the first national comparison of school districts through 2025, and offers a detailed picture of how individual school districts have performed over time. It underscores that many districts have experienced a long-term slump in student achievement, not just a blip during the pandemic.
From 2017 to 2019, students lost as much ground in reading as they did during the pandemic, and reading scores continued to fall at a similar rate through 2024.
Immediately after the pandemic, there was hope that students would recover quickly. The new data shows that scores inched upward in reading last year, and have climbed more steadily in math since 2022. But it has been nowhere near enough to make up for lost ground, researchers said.
The biggest losses have been among the lowest-achieving students.
Covid closures were very bad for test scores, especially for the lower half of students. The children of the Laptop Class could kind of learn from Zoom classes. But blue collar and underclass kids benefit from going daily to an organized place, e.g., a school, and getting talked at by middle class grown-ups. School is not a panacea, but it’s a lot better than their not going to school.
… A report on the new data describes a decade-long “learning recession.” It was released Wednesday by the Education Scorecard, a joint project by Sean Reardon at the Stanford group; Thomas Kane at the Center for Education Policy Research at Harvard; and Douglas Staiger at Dartmouth.
The data includes third- through eighth-grade test scores for districts in 40 states and the District of Columbia, as of the end of last school year. It accounts for about 68 percent of U.S. school districts nationwide. (Ten states were excluded, among them New York and Illinois, because of high opt-out rates or noncomparable data.)
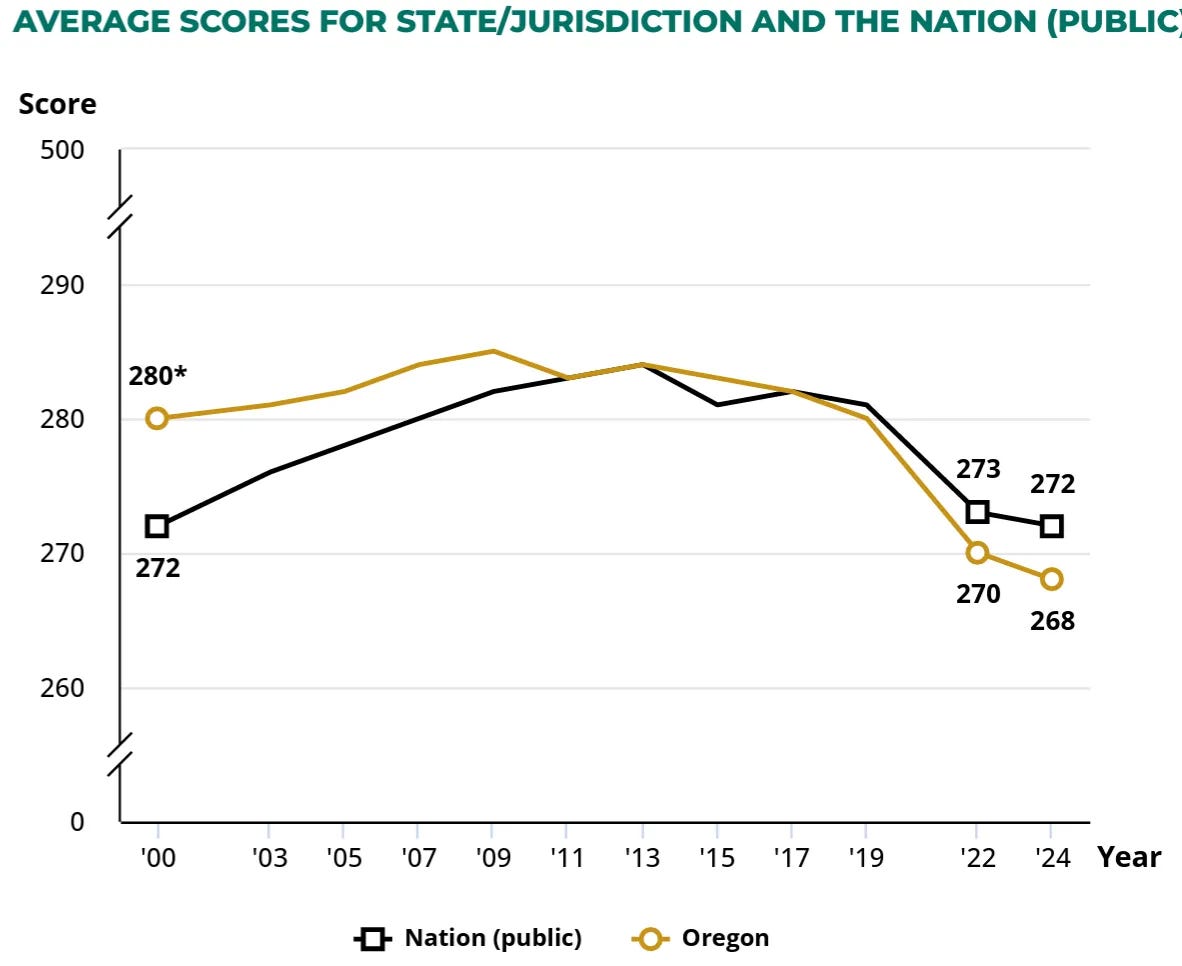
Sadly, there is no data on Oregon, which by all accounts has committed educational harakiri in recent years in the name of Diversity, Equity, and Inclusion, as I reported in March 2025 in my Substack post “NAEP Test Scores: Mississippi Miracle vs. Oregon Outage.” Oregon, with lots of whites and some Asians, used to score above the national average on the federal NAEP tests. But then the powers that be in Oregon decided that that was racist, so they stopped it:
The NYT offers a handy page:
As an example, the NYT offers the nation’s second largest school district, Los Angeles Unified School District, which actually got relatively better from 2015 to 2025:
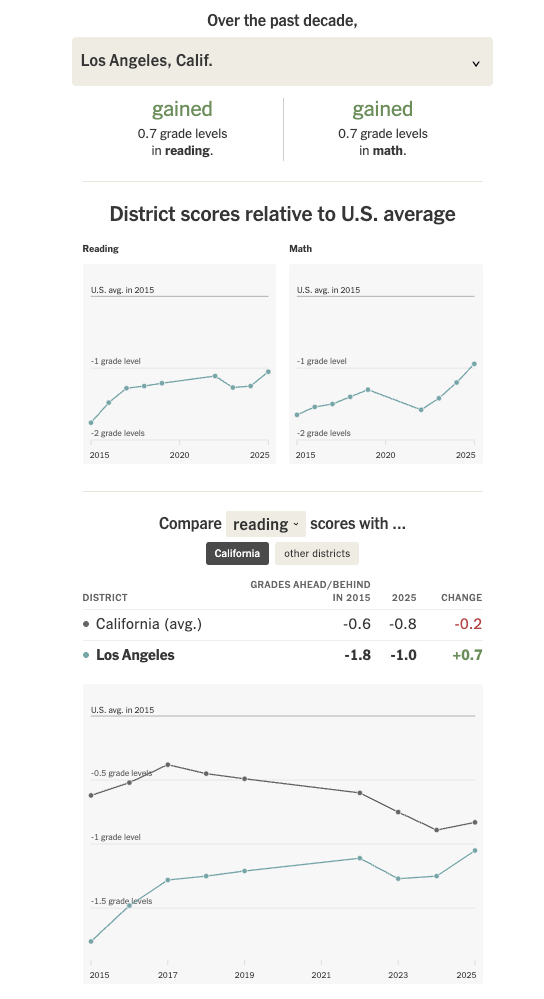
The giant LAUSD is notorious for its sclerotic bureaucracy, so if LAUSD can improve, then your school district should be able to too. (But your school district probably is not improving.)
Back to the NYT:
Education experts say there is no single reason for the declines. But the timing provides some clues.
Students’ test scores had been increasing since 1990 — then abruptly stopped in the mid-2010s. That coincided with two events: an easing of federal school accountability under No Child Left Behind, which was replaced in 2015, and the rise of smartphones, social media and personalized school laptops.
The pandemic then accelerated learning declines, especially for the poorest students. Some pandemic effects have lingered. Student absenteeism, for example, remains higher than prepandemic.
In one in three school districts in the United States, students are reading a full grade level lower than they were in 2015.
Only a few states, like Mississippi, have avoided the plunge.
I wrote about the miracle in Mississippi and some other hard-headed Southern states here. Short answer: it appears to be more or less real, although don’t get your hopes up for vast long term changes.
Here’s the NYT’s graph:
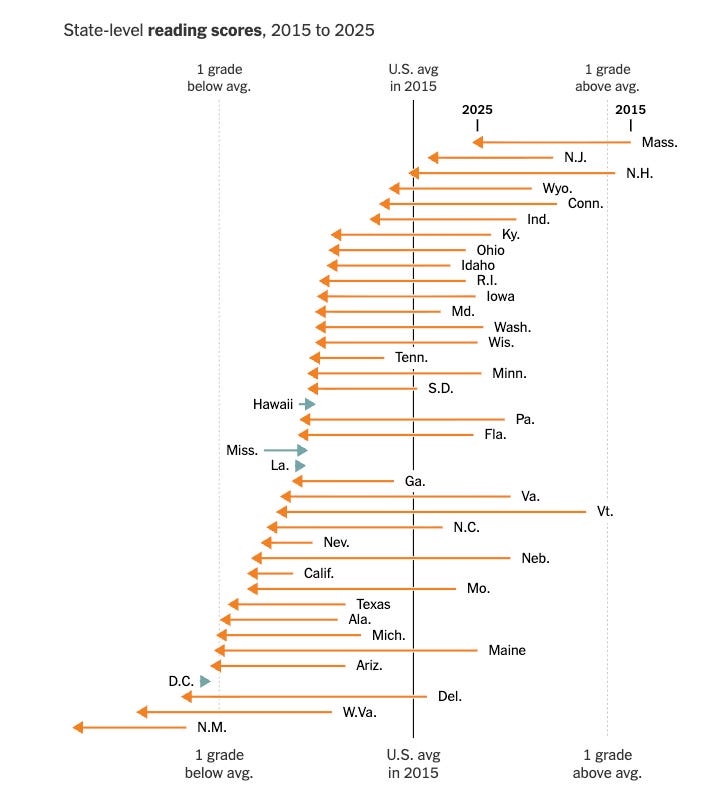
Mississippi and Louisiana implemented similar phonics-oriented reforms, which included holding back the worst students in third grade for another year of learning-to-read rather than sending illiterates on to fourth grade and the reading-to-learn part of schooling. This will artificially boost test scores a little, but it seems to be working more broadly than that. By 8th grade, not as much, but still something good is happening. There is much to be said for instilling basic literacy in dumb kids so as adults they can read signs and other things needed for employability above the “Tote dat barge! Lif' dat bale!” level.
Washington D.C. is up slightly because it is gentrifying. So it now has enough white children in its public schools to reach a statistically significant sample size of whites (which wasn’t true of D.C. 20 years ago when the NAEP couldn’t find enough white kids in D.C. public schools to even report their scores).
I don’t know what’s going on in Hawaii. Something not bad, evidently, but I don’t hear as much about Hawaii anymore as I did when I was young.
Oregon couldn’t get their act together to report the needed data, so its shameful performance isn’t shown on this graph.
The biggest drop on the graph is in ultra-Democratic and very white Vermont. In general, liberal New England states did a little worse on average than other states. But most states that aren’t actively following the phonics-centered reform pioneered a couple of decades ago in Florida did badly.
For example, rightwing and (downscale) white West Virginia continues its plunge.
Giant California didn’t fall as much as most states, even less than Texas, which did a little less worse than average.
Is California getting so expensive that it’s squeezing out low scorers? Perhaps in the future, the entire population of California will be 10,000 AI engineers with 160 IQs making an average salary of $10 billion per year, plus their harems.
Below the paywall I will consider the broadest lessons that could be learned (but won’t) from this failure of American thinking about education:
Paywall here.
